Singapore, 25 September 2019 (Wednesday) – The Institute of Service Excellence (ISE) (卓越服务研究院) at Singapore Management University (SMU) today released the 2019 second quarter (Q2) Customer Satisfaction Index of Singapore (CSISG) results for the Air Transport and Land Transport sectors.
In the latest results, the Air Transport sector scored 76.1 points on a 0 to 100 scale. This was a 0.9% improvement over last year. The Land Transport sector scored 68.0 points, a 0.3% improvement over the previous year. However, both improvements were not considered to be statistically significant.
Land Transport
The Land Transport sector, comprising of the Mass Rapid Transit (MRT) System, Public Buses, Taxi Services, and Transport Booking Apps sub-sectors, saw its customer satisfaction score inch up from 2018; all four sub-sectors recorded marginal improvements year-on-year, although the increases were not statistically significant.
Leading the improvements were the MRT System and Public Buses sub-sector. The MRT System sub-sector scored 64.9 points, a year-on-year increase of 2.0% while the Public Buses sub-sector scored 66.7 points, a 1.8% increase. Notably, this was the Public Buses sub-sector’s best performance since CSISG tracking began in 2007.
The Taxi Services and Transport Booking Apps sub-sectors also recorded higher scores year-on-year, scoring 73.3 points and 68.3 points, improvements of 1.2 % and 0.5%, respectively.
Please Mind the (Expectations) Gap
Closer examination of the study’s metrics within the MRT System and Public Buses sub-sectors revealed that the higher scores were driven by significant improvements to perceptions of quality.
In particular, the difference between local MRT commuters’ perceived quality and their expectations has been narrowing over the past three years. Local MRT commuters had an average Perceived Quality score of 65.3 points compared to an average Customer Expectations score of 68.0 points, a negative gap of 2.7 points; this gap was 4.0 points last year and 5.0 points the year before.
Mr Chen Yongchang (陈勇畅), Head of Research and Consulting at ISE, said “While MRT commuters’ levels of perceived quality still fell short of the quality they were expecting to receive, the observed narrowing of the gap between these two complementary metrics suggests that Singaporeans’ collective psyche is gradually recognising the tangible improvements to our rail network.”
“In fact, for the Public Buses sub-sector, which benefited more quickly from the government’s Bus Service Enhancement Programme, local commuters’ level of perceived quality had steadily risen to become on par with what they were expecting,” he added.
The improvement in the Public Buses sub-sector’s Perceived Quality score was supported by substantially higher locals’ satisfaction ratings across all measured public bus quality attributes, such as “Safety of the Ride”, “Comfort of the Ride, and “Bus Frequency”.
Evolution of Taxis and Private Hire Cars
Although the Taxi Services and Transport Booking Apps sub-sectors only saw marginal upticks to their 2019 overall CSISG performance, further observations of local respondents highlighted taxis had outperformed private hire cars in 8 of the 9 satisfaction attributes they shared in common. In particular, the “Helpfulness of Driver” and “Driver Road Knowledge” attributes were markedly better for taxis, compared to private hire cars.
“Incumbents and new entrants alike should look to differentiators to enhance the rider experience. This can be in the form of improving existing elements, such as service training for drivers, but also introducing innovations to the experience, such as app-based payment options for taxi street hails,” remarked Mr Chen.
Air Transport
The Air Transport sector, which comprises of the Airport, Budget Airlines, and Full Service Airlines sub-sectors, saw an uptick in customer satisfaction from 2018. Driving the increased score was the Full Service Airlines and Airport sub-sectors. Full Service Airlines recorded 75.3 points while the Airport, essentially Changi Airport, recorded 79.0 points, increases of 1.1% and 1.3% respectively, compared to the previous year.
On the other hand, the Budget Airlines sub-sector dipped by 1.0% year-on-year to score 72.4 points.
What Matters Most to Passengers
Looking into the differences between the drivers of quality for Full Service Airlines and Budget Airlines, airline staff — both on the ground and in the air — stood out as a common driver for both types of airlines. For short-haul flights, analysis revealed that friendly cabin crew and staff empathy were among the top five quality drivers. For medium-haul flights, the data suggested staff empathy and professionalism were the key drivers.
Ms Neeta Lachmandas (妮塔.拉切曼达斯), Executive Director (执行总监) of ISE, commented: “Different aspects of the flying experience matter, depending on whether the traveller was on a budget or full service carrier, and also how long the flight was.
“Regardless, the people dimension of empathy, congeniality, and professionalism showed up in the analysis, suggesting this is a key area airlines can focus on to differentiate and improve customers’ flying experience,” she added.
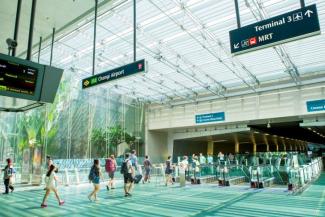
Automated Check-In At Changi Airport
With the roll-out of Automated Check-in Machines across Singapore Changi Airport’s terminals, a substantial proportion of passengers have had experience with the new machines. Segmenting passengers by those who had used the machines against those who had not, the data indicated that levels of customer satisfaction and perceived service quality were practically the same: Passengers who used the machines had an average satisfaction score of 79.0 points while those who did not averaged 78.8 points.
“As self-serve technologies, such as supermarket self-checkout machines and fast-food ordering kiosks, become more prevalent and more pervasive across multiple industry sectors, it appears that consumers are willing to accept these technologies with no observable impact to customer satisfaction levels.
“This finding should alleviate concerns that productivity solutions that free up manpower will negatively affect the customer experience. Rather, companies should use the opportunity to upskill staff so that they can provide higher value-added services,” Ms Lachmandas commented.
The CSISG 2019 Q2 study was conducted between April and July 2019. A total of 6,400 respondents, comprising of 3,690 locals and 2,710 tourists, were surveyed.
Please refer to Annex A for a background on the CSISG and Annex B for the detailed scores.
*********
For media queries, please contact:
Mr Tim Zhuang
Senior Manager, Partnerships and Programme Development
Institute of Service Excellence (ISE) at Singapore Management University
DID: (65) 6808 5258
Mobile: (65) 9748 9389
Email: timzhuang [at] smu.edu.sg (timzhuang[at]smu[dot]edu[dot]sg)
Mr Teo Chang Ching
Senior Assistant Director, Corporate Communications
Office of Corporate Communications and Marketing
DID: (65) 6828 0451
Mobile: (65) 9431 8353
Email: ccteo [at] smu.edu.sg (ccteo[at]smu[dot]edu[dot]sg)